Let’s Face it, You’re Predictable: Web Analytics Meets Predictive Analytics

Predictive Analytics at Target

The world of marketing is driven by intuition, compelling copy, engaging graphics, brand positioning, and advertisement placement, making those numerically-driven departments in an organization somewhat uneasy. But, within the past twenty years, the field of Web analytics has emerged, fueling marketers with quantifiable indicators that their copy, graphics and positioning are succeeding, according to Lesson 1 of my West Virginia University Web Analytics & SEO class.

When it comes to social media, again, marketers encounter difficulty quantifying its effectiveness. One blogger, named Auggie Ray, at Forrester Research writes, “The smart marketer will approach the question of value as if the answer is zero — there is no intrinsic value to a Facebook fan.” Clearly, seeking to quantify social media activity and interaction with customers and prospective customers can be difficult. But the use of Web analytics gathers, what Information Management calls  “ever-growing volumes of raw data,” so that it can pull out trends in site visitors’ click-throughs and “drill-down behavior.”

If anyone arrives on a website because of a social media post, Web analytics will know. In the reverse, if a site visitor hits “Like” via a button on the company’s Facebook page, the company can identify who the individual is, analyze his/her movement within the site, and review his/her subscriptions and purchases. Then, based on predictive web analytics, the company can pull aggregate data based on the demographics of that individual and Friend of a Friend (FOAF) data to predict how he/she will likely spend. This analysis of an individual customer can be replicated on many of the sites’ visitors, thus linking social activity to purchase data, allowing businesses to fiscally quantify social media activity.

Beyond that, by setting up re-direct links within a website and using one specific link per each ad/social media post will allow analytics tools to identify which ad, specifically, drove customers to the site. This sheds light on how post timing, copy, graphics, and/or links may have played into the customer’s decision to click through.

Clearly, web analytics make it easier to see what creative elements solicited customer action, which customers are likely to purchase, how customers move through a website, sand what their likelihood of purchase/re-purchase is. This invaluable data provides justification for spending and direction for marketing strategy and website optimization.

In what ways does web analytics help your company make predictions about what customers are going to do next? How has this affected your revenue generation?

How to Make Every Detail of Your Web Site Perfect: A Look at Crate & Barrel’s Strategy

Photo Credit: Reuters.com

Photo Credit: Reuters.com

Crate & Barrel’s Story

For those of you who are unaware of the brilliant, beautiful retailer called Crate & Barrel, allow me to introduce you. Crate & Barrel was founded in the 1960’s by an inspired newlywed couple in Chicago, Illinois. According to Crate & Barrel’s Web site, the couple had recently returned from their honeymoon to Europe, when they set out to make the chic and beautiful European home furnishings available in the United States. This endeavor led them throughout Europe, buying directly from glassblowers, coppersmiths, and bistros. When the couple returned home, they had no funds to purchase displays f0r their merchandise, so they stacked everything on the shipping crates and overseas barrels that brought the goods to America. Thus, the name Crate & Barrel.


Beautiful, Both In-Person and Online

If you have ever shopped in Crate & Barrel, you will see that its store aesthetic harkens back to that of its original 1960s stores. Its European-inspired furniture, glassware, dishes, throw pillows and decor are all displayed on unassuming shelves in an airy, inspiring layout. Each product is carefully lined up in rows, stacks, bins and buckets to assemble a beauty-by-sheer-quantity look. Crate & Barrel stores include convenient wedding registries, friendly staff, and beautiful whites and wood tones that beckon you to buy.

Crate & Barrel Store

Crate & Barrel Store

Though the stores are a sight to be seen, in my opinion, the real brilliance of Crate & Barrel’s merchandising lies in its online store, where Crate & Barrel has leveraged Web analytics, multivariate testing and A/B Testing to ensure that its Web Site converts the maximum amount of site visitors into sales. Here’s how they did it:


What Exactly is Multivariate Testing?

Let’s start with “multivariate testing.” According to VisualWebSiteOptimizer.com, multivariate testing requires directing different Web site visitors to different versions of the Web site in order to test which version of the Web site produces the desired outcome. Items such as headlines, tag lines, images, colors, buttons, text, logo placement, etc. are manipulated in the test groups to see which items generate sales, clicks-through, or donations, or whatever site’s key performance indicators (KPIs) are.

Here is a visual that may help you understand multivariate testing:

Image Credit: Visual Web Optimizer

Image Credit: Visual Web Optimizer


What Exactly is A/B Testing?

Along with multivariate testing is “A/B Testing.” According to Optimizely, A/B Testing is the process of “pitt[ing] two variations against each other.” A good example of A/B testing is changing the text on a check out button to read “Buy Now” or “Checkout” and testing with two random groups to see which button generates more sales. Other items can be manipulated as well, including the check out button’s color, placement, size, etc. This may help you visualize A/B Testing:

Image Credit: Optimizely

Image Credit: Optimizely

By testing literally every detail of a Web site, multivariate and a/b testing can help companies identify the most compelling layout to psychologically stimulate customers to perform the desired actions.


How Crate & Barrel Used Testing to Perfect its Site

Crate & Barrel uses multivariate and a/b testing to continue to improve its Web site, according to Examiner.com. Joan King, Crate & Barrel’s ECommerce Director and Site Optimizer and Analyst, explained that Crate & Barrel saw a 20% increase in conversion rate “due to simple changes in wording and color,” according to Examiner.com. Crate & Barrel is ALWAYS testing, and many of the tests run for two weeks at a time to allow Crate & Barrel to get an accurate read on how site visitors are responding to the small changes. Here is what the site looks like on my computer today. It may look just slightly different for you or just slightly different tomorrow because Crate & Barrel is constantly using Web analytics to improve its site.

Crate & Barrel Homepage: December 9, 2013

Crate & Barrel Homepage: December 9, 2013


Where Web Analytics Comes In to Perfecting Web Sites

Now that we’ve discussed how Crate & Barrel changes visual elements on its Web site to improve the aesthetics and conversion rate of its Web Site, let’s examine how exactly they know which visual variations are winning out. Crate & Barrel uses the Searchmetrics software for its SEO Analytics, and it uses Omniture SearchCenter for its Web Analytics. Omniture provides Crate & Barrel with a whole slew of Web analytics data, but a few funnels receive the majority of the attention when testing different visual elements. (Refresher from an earlier blog of mine: Funnels are “path[s] that you expect visitors to take on the way to a conversion goal,” according to Web Metrics & SEO Lesson 6.)

According to a Lecture given by Joan King, Crate & Barrel keeps a close eye on its “Confirm page” and on those who proceed to check out without ever completing the transaction at the “Confirm page.” This information helps determine if the visitors were converted into sales. With each visual element change, Joan King and her team are asking, “Did this element do better or worse at driving site visitors to the confirm page?” If the answer is yes, then the element is implemented (and possibly vetted against other options in the future). Monitoring this funnel and the actions visitors take to get to the goal page (Confirm) helps ensure that each tweak is helping Crate & Barrel get closer to a perfect Web site both aesthetically and logically.

How to Make this Work For You

If you want to perform multivariate and/or a/b testing on your Web site, there are services you can subscribe to that will help you pull off this testing. One of the companies I mentioned earlier, VisualWebSiteOptimizer.com, does just that. Or, you may be able to perform your own version of multivariate or a/b testing by modifying specific visual elements of your Web site and leaving them active for a couple weeks at a time. Though this will not get as accurate of a read (due to different time frames, instead of simultaneous testing), it can shed some light on which elements preform better. Then, as these elements are implemented, use your Google Analytics account to keep an eye on your Multi-Channel Funnels and on your goal pages (i.e. your “confirm” page, or your “Thank you” page). Also keep an eye on the traffic flow people follow in your site, and keep an eye on your E-Commerce reports (specifically your Sales Performance Report and your Time-To-Purchase Report) to see if the changes are resulting in the conversions you wish to earn.

Armed with tested and tried data, you’ll be well on your way to perfecting the details of your Web site and increasing your conversion rate.

Using Web Analytics Goals: How to Make Your Google Analytics Data Actionable

Image

Photo Credit: HubSpot

Actionable Information vs. Raw Data

Wouldn’t you agree that, as a business leader, you’d rather have actionable information than raw data? Unless you are an analyst, my guess is you would resound with, “Yes!” And I would, too. As a businessperson, it is much easier to drive my business forward when I have data that is meaningful, relevant and immediate. But, how can I wade through mounds of meaningless metrics in order to ascertain whether my Web site is serving its intended function or not? Enter the web analytics tools.

In my earlier post, I encouraged my blog followers to start using the web analytics platform, Google Analytics, for even as little as 20 minutes per day because it is the cheapest and most readily-available web analytics tool on the market, and I believe it can yield great returns in the efficiency and revenue-generation-capability of your Web site. Building upon last week, let’s use Google Analytics as an example platform to gather actionable information from your Web site. Within any web analytics software, three tools will help you gain actionable data: goals, funnels, and filters. Today we will focus on the first of these – goals – so and how to implement and track them. So, get ready to start working because after this you’ll have the eyes to see what needs to be done to make your web site perform its intended role.

Image

Photo Credit: HubSpot

How Web Analytics Goals Work:

At first glance, web analytics goals sound very similar to the goals of any other business endeavor:

“specific strategies you’ll leverage to accomplish your business objectives,” as Avinash Kaushik defines them in his blog post “Web Analytics 101: Definitions: Goals, Metrics, KPIs, Dimensions and Targets.”

However, web analytics goals are much more specific and much more immediately measurable. According to Piwik, a web analytics software provider and competitor of Google Analytics, web analytics goals are “priorities” a company wishes to fulfill with its Web site, such as – sell an item, obtain a new customer, download a brochure, obtain a donation, or register for an event.

Take a moment and ask yourself, “What are my ‘priorities’ for my Web site?”

I’ll tell you what mine are. For this blog, my priorities are – get a new follower, get a comment, get a post “liked” or “shared” on a social media channel, and obtain a new client. Once you’ve defined your goals, you can identify what success looks like. To do this, think about what, on your Web site, would indicate that this goal has been fulfilled. According to my current course Web Analytics and SEO, Lesson 6, there are four different type of goals companies tend to have for their websites:

  1. URL Destination – which web page do you want people to end up on?
  2. Visit Duration – how long do you want people to spend on your site?
  3. Pages/Visit – how many pages do you want them to go to on their visit?
  4. Event – what, exactly, do you want them to accomplish?

Labeling goals in terms of outcomes helps make the web metrics you are seeking immediately more actionable. Many of my goals are event-based, but they can be viewed in light of some of these other categories, which can help me better determine of the goal has been met. Note how some of my goals could be categorized into different types of goals, shaping which metric I analyze to determine if the goal has been met:

  • Get a new follower > Event = hitting the “follow” button, OR URL Destination = arriving at the “Thank you for subscribing” page
  • Get a new comment > Event = submit a comment, OR, URL Destination = arriving at the “Thank you for your comment” page
  • Get a post “liked” or “shared” on a social media channel > Event = like/share
  • Obtain a new client > Event = submit a request for a demo, OR URL Destination = arriving at “Download our quick-start guide” page

How to Set up a Goal:

  1. To set up a goal in Google Analytics, log in, go to “Conversions” along the left sidebar, and click “Goals.
  2. Click the box “Set up goals,” and select one of the template goals, or set a custom goal for your website.
  3. Once you hit “next step,” name your goal. Then, select if your goal is a “Destination,” “Duration,” “Pages/Visit,” or “Event”-based metric.
  4. Set up the “Goal Details,” according to which type of goal it is.
  5. Once you have entered the goal details, check to “verify this goal,” seeing how many times the goal would have been met in the past week.
  6. Save your goal
  7. Repeat the above steps, setting up Google Analytics goals for each goal you have set for your website.

Once these goals have been identified and set up in Google Analytics, the software will do the work itself, providing you with information specifically about what you want to know rather than the standard template reports that provide metrics that are not actionable. For me, taking a look at the number of followers my blog generated this week, helps me identify what are the best ways to drive traffic to my blog, and what are the most interesting topics to my readers. This information helps determine the way my site takes shape, and I believe, if implemented, knowing how your goals have been met will steer the direction of your website as well.

Don’t Forget Funnels and Filters!

Along with the web analytics dialogue about web analytics goals, comes mention of the two other major ways to get Google Analytics to provide actionable information. Funnels are “path[s] that you expect visitors to take on the way to a conversion goal,” according to Web Metrics & SEO Lesson 6. This helps identify which steps customers should take to arrive at your desired conversion goal, and it helps you orient your Web site in such a way as to encourage, coerce, nudge, direct (whichever word you may prefer) your site visitor to arrive at a desired outcome or complete a desired event.

Filters are similar to Goals in that they provide data to help identify if individuals have performed the desired action. Setting up a Filter is very similar to setting up a goal in Google Analytics, and these filters can provide “a way to manipulate data to provide accurate reports, showing specific data,” according to Web Metrics & SEO Lesson 6. Filters can include analyzing which domain the traffic is coming from, which IP addresses are generating traffic, and which sub-directories are sending traffic to your site. These numbers can help identify where people are coming from, so the site can better be oriented to welcome them.

Again, the more specifically you get Google Analytics to drill down into your data, the less you have to wade through, and the more actionable and immediate your data can be. Knowing the funnel through which your visitors are being directed, and setting up filters to view data according to where they are coming from all sheds light on how you can maximize and accelerate your Web site to perform its intended purpose and accomplish your goals.

Have you set up any goals for your Web site? How have these helped you see ways you may need to change/re-organize your site?

Google Analytics: Why Less is More in Small Business Web Analytics

Image

Before this year, I had very little exposure to Google Analytics. In fact, I had very little exposure to Web metrics at all, but as I have spent time analyzing the traffic patterns on Web sites, as well as the referral sources, clicks-through, landing pages, social shares and mentions and the ways that blogs contribute to corporate search engine optimization, I have begun to fall in love with the importance of analyzing Web site traffic. Now, I know you are busy and do not have the time you need to sit down and watch how people interact with your Web site, but might I suggest considering spending even twenty minutes per day checking to make sure your Web site is doing what you intend for it to do. Remember less is more. Starting some Web analytics can make the world of a difference over no Web analytics at all.

Where to Start with Web Analytics

Let’s start with intentions, using this blog as an example. My intentions for this blog are to provide content that engages readers, welcoming you all to click on multiple articles and spend time learning from the things I have learned. Beyond that, I hope that my site will allow you to see that Amy Bayer Marketing can help your company with many of the day-to-day marketing tasks that you may not have time for or with which you may want to employ our expertise. So that you can get me and my team on your team, helping you accomplish your business’ goals. With these two key performance indicators (KPIs) in mind, let’s take a look at how Google Analytics says I am performing.

Why Google Analytics is Probably Sufficient for You

As an aside, I am using Google Analytics because it is a free service, available at no cost for just about everyone (unless your website has over 10 million visits per month, in which case it will cost you $150,000 per year). Google Analytics is set up to allow you to track traffic for just about any function of your website. For most companies, Google Analytics is sufficient, but for those desiring more in-depth data, I recommend looking into HubSpot, GoSquared, Hootsuite, ClickTale, IBM Digital Analytics, Mixpanel, Piwik (free), VisiStat, XiTi, Adobe Site Catalyst and other fee-for-service analytics providers.

Getting Started with Google Analytics

To get started with Google Analytics, open an account, indicate which Web site you want to track, and generate a tracking code to plug into your site. Opening another window on your browser, bring up your site and insert the tracking code. For more information on tracking code placement, read this article on Yoast.

Once you have inserted the tracking code into your Web site, you are ready to begin tracking. After about a week or so, your site will have captured data about site visitors, their time on your site, the average number of pages they viewed, how long they spent on each page, where they were located when they visited your site, what Web browser they used when visiting your site, if their visits generated any revenue for your company, what operating system they were using when they viewed your site, who their internet provider is, and what their typical flow through your website is, including the page from which people typically leave your website. Surprising, isn’t it? The way I see it is:

Just think of what you could do, armed with such expansive data, to improve your website or cater your marketing efforts toward the needs and wants of your target audience as expressed in their use of your website!

My Most Important Metrics

Obviously, unless a company has a full-time analytics team, it is going to have a difficult time leveraging all of the data available in every area of digital communications. So, selecting most important metrics can be helpful. Again, these key metrics should be chosen based on your company’s key performance indicators. Here are some of the most helpful metrics Google Analytics has provided me in dealing with the key performance indicators of this blog:

  • Visitors Flow: This gives a visual representation of where people click, then click next, then click next on my blog. This helps me to discern which pages are driving traffic to which pages. This metric is helpful in blogging because it indicates which pages drive people to new blog posts. In the world of e-commerce, this metric can be particularly helpful in determining which pages drive site visitors toward the purchasing pages. Here is a visual of Visitors Flow in action: 

Screenshot: Google Analytics Visitors Flow

  • Average Visit Duration: The Average Visit Duration metric is helpful for Web sites that are seeking to engage readers with content. And, this metric can be helpful for companies that have found that sheer time exposure to a product boosts sales of that product. Either way, Average Visit Duration is helpful for me as a blogger in that it indicates how much time people are spending reading the content I am developing. Google Analytics makes it easy for you and includes this metric in the dashboard, so it is one of the reports you can have easy-access to.
  • Location: This metric may not be as helpful for someone in the service industry or for a communicator/blogger as it would be for a product distributor, but it is absolutely fascinating! When pulling up the Location metric in Google Analytics, it displays as a map of “hotspots,” indicating from where your site visitors are coming. It can also display the language in which they are reading your Web site. This can be helpful for product distributors, as it can shed light on which region of the country and of the world could benefit from a manufacturing, distribution or retail location due to high demand. Here is what it looks like:
Google Analytics: Location Screenshot

Screenshot: Google Analytics Location

  • Frequency & Recency: These metrics go beyond the simple “unique visitors” metric to explore HOW OFTEN the same individual visits the site and HOW RECENTLY did they visit. This metric is helpful for bloggers and other Web sites seeking to build affinity and loyalty because it provides concrete numbers of how many people are coming back. It can also be helpful for events-based organizations seeking to boost attendance at events, as they can see how many people continue to come visit the digital events calendar. More, it can be invaluable for e-commerce websites seeking to solicit repeat sales from customers. As a side note, many companies in the direct marketing industry leverage frequency and recency for a system called “predictive analytics.” Predictive Analytics couples frequency and recency with monetary value to discern which customers are the most likely to spend, what they are likely to buy (based on their purchase history and aggregate data from others like them), and how much they are likely to spend. Companies like Coldwater Creek leverage predictive analytics to boost sales and customer loyalty.

These are four metrics I like. The Google Analytics list goes on and on, and they’re all free! My suggestion is this – set up an account, start tracking, and choose four metrics that you want to keep an eye on. Then, spend maybe 20 minutes per day looking at the data and making adjustments to your website. In the end, those 20 minutes per day could end up being the most financially lucrative 20 minutes of your day. Who knows? You may just find a fluke in your website that is keeping people from being able to check out, or driving them away for some silly reason. Either way, Web analytics can pay off greatly in the long run while still keeping in focus the principle LESS IS MORE.

Your Smartphone is Betraying You [Infographics]

Don’t believe me that your smartphone is telling retailers, mortgage brokers, friends, neighbors and that creepy co-worker about where you went to dinner last night and how often you leave the country? I don’t mean to freak you out, but yes, this post offers you the invitation to start to view your precious little iPhone/Android as your potential worst nightmare. Check out this infographic:

Image

Ahh! Do all apps do this?
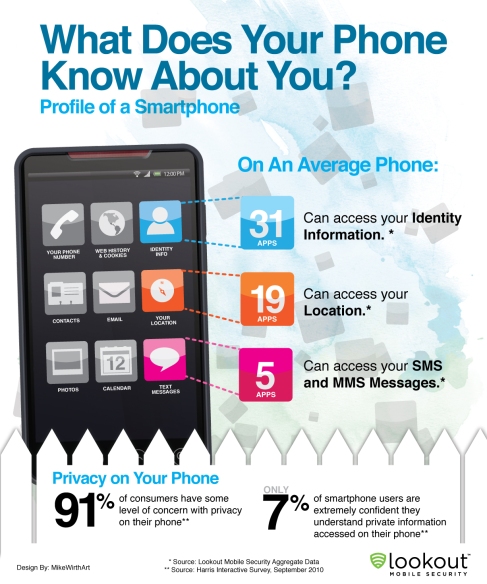
Not all apps provide the company with your personal information, but the majority do. Most apps offer you the opportunity to allow or deny access your personal information, but some do not. Go to your settings to edit your security preferences, or consider deleting an app without security options.

Did you know, the average person has 41 apps downloaded to his/her smartphone, according to a Nielsen Report featured on thenextweb.com? On average, as you can see above, 31 of these apps can access your identity information, 19 can access your location information, and 5 can access your text messages. And, as you can see 91% of people are at least mildly concerned about this.

Sure, apps can be helpful little tools for creatively waking us up in the morning, making our pictures look like photo booth reels, playing only our favorite music, navigating us to our destinations, organizing our meetings, sending 10-second picture texts to our friends, helping us shop, tracking our workouts, entertaining us with games, and tracking some of our most personal information like calorie intake and menstrual cycles, but what do these apps know about you? The question for you is: Which is more important to me, privacy or some functionality? It’s really up to you.

Why do marketers want this information?
I am a marketer, so let me explain, because it’s actually an earth-shattering innovation when seeking to segment a market! Marketers generally get a higher return on investment when sending a marketing message to an individual most like their typical customer. And, if they have multiple types of customers, the more they know about you, the more relevant the message they send you will be. For example, when I was working for the YMCA, we segmented our market to Seniors, Adults and Families. With Seniors, our messages revolved around enjoying life, taking care of yourself and making friends. With adults, our messages were about meeting your fitness goals. With families, our messages were about spending time together, living a healthy lifestyle, building confidence and making memories together. The more information I have about someone, the better I’ll know if they’re worth spending my money to try to attract to my company and the better appeal my message to them will have.

But, what if I’m a consumer? Is this good news or bad news?
It can be both. If you are seeking a deal, or you are interested in knowing about the latest, greatest product, service or event in your area, keep your eyes out because the messages you receive will become increasingly more appealing over the years as you produce more online data through posts, web searches, online purchases and location check-ins because more data will be available to marketers about who you are and what you’ll likely want to buy.

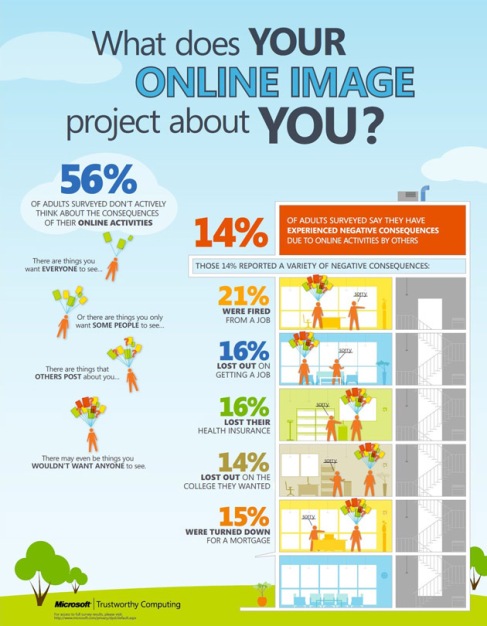
Now, on the downside, you may be categorized incorrectly with a group of individuals not especially like you. Researchers call this “aggregate data,” but the New York Times rightly identifies it as a type of “stereotyping.” For example, if you like running or only drink red wine on Saturdays, there are a whole slew of consumers with those similar interests, some exactly like you, others extremely different from you. Just hope that their financial behaviors are similar to yours, or you’ll be incorrectly profiled. This New York Times Article explains how aggregate data works with mortgage companies, for example. Based on individuals’ names, addresses, demographics, and online/offline purchasing data, companies identify and categorize customers (according to Lesson 9). This customer profiling is very common in both the marketing and the lending world, and in the business world at large, meanwhile, unbeknownst to you, your app usage, personal interests or web searches might determine whether or not you get approved for a loan (depending on if you fit the profile for a typical high-risk-for-default customers). Here’s another infographicyou might find interesting:

Image

Where do companies get this information?
There are companies called “Data Aggregators” that specialize in pulling together data for marketers to use. One of the largest data aggregators in existence is called Spokeo. This site is pretty interesting because you can actually look up information on people, including searching those annoying telemarketers’ phone numbers and registering a complaint! On the other hand, if you look up your number, you can most likely pay only 95 cents to see your full name, address, email address, month/year of birth, location history, and relatives. Does that freak you out? It freaked me out when I looked up my husband’s phone number!

In addition to data aggregators, there are about 10 major web analytics companies that businesses can hire to help them track the success of their website and capture website visitor data for future marketing purposes. According to eWeek’s Enterprise Applications: 10 Hot Data, Web Analytics Companies That You Should Know: 

  • Woopra: This company tracks 200,000 websites for its clients and provides information for them to interact with and engage site visitors.
  • Google Analytics: This is a free service used by about 57% of the top 10,000 websites to identify how people find their website, what pages they click, where they’re located, etc.
  • Kontagent: This company specializes in viral and social network analysis.
  • Flurry: Smartphone owners, here’s your winner. Flurry works with more than 60,000 companies in over 150,000 apps to capture data from your “iOS, Android, Blackberry, windows phone, JavaME, and HTML5 platforms.”
  • Radian6: This company specializes in social media engagement and measurement tools, so companies can better use social media channels to communicate brand messages.
  • Open Web Analytics: This open-sourced system enables companies to use multiple web analytics softwares simultaneously.
  • Piwik: This international web analytics team works on over 250,000 websites in over 45 languages and is constantly releasing new versions of the software that grabs the data.
  • Optimizely: This company specializes in helping businesses lay out their website using graphics that are most likely to appeal to consumers.
  • HitTail: This company helps businesses see what search terms people are typing into search engines in order to help businesses put those words into their websites for SEO.
  • Metricly: This is a one-stop shop for companies to pull graphs, data, financial data, etc. on internet users and a company’s website visitors.

These analysts are mostly for computer-use analytics, but don’t be confused. Check out all the data they can pull from your smartphone:

Smartphone Data Infographic

So what’s the bottom line? 
For marketers: LEVERAGE THIS INFORMATION! But use your conscience and, please, don’t exploit people. You’re a consumer, too, and you know your personal information is precious.

For consumers: I recommend two things:

  1. Don’t fret what marketers know. They are legally required to allow you to “opt out” / “unsubscribe” or be asked to be put in the “do not call” list (which you can actually do on Spokeo on your own.) So, they can’t bother you forever, or they can get HUGE fines.
  2. Try to increase the security settings on your phone, tablet and computer for the sake of personal privacy. This includes turning off the “location” settings on your apps and your camera and deleting any apps you cannot set the security settings for.

Fascinating stuff, isn’t it? What are your thoughts? Does this freak you out, or were you aware of this before?