Photo Credit: Reuters.com
Crate & Barrel’s Story
For those of you who are unaware of the brilliant, beautiful retailer called Crate & Barrel, allow me to introduce you. Crate & Barrel was founded in the 1960’s by an inspired newlywed couple in Chicago, Illinois. According to Crate & Barrel’s Web site, the couple had recently returned from their honeymoon to Europe, when they set out to make the chic and beautiful European home furnishings available in the United States. This endeavor led them throughout Europe, buying directly from glassblowers, coppersmiths, and bistros. When the couple returned home, they had no funds to purchase displays f0r their merchandise, so they stacked everything on the shipping crates and overseas barrels that brought the goods to America. Thus, the name Crate & Barrel.
Beautiful, Both In-Person and Online
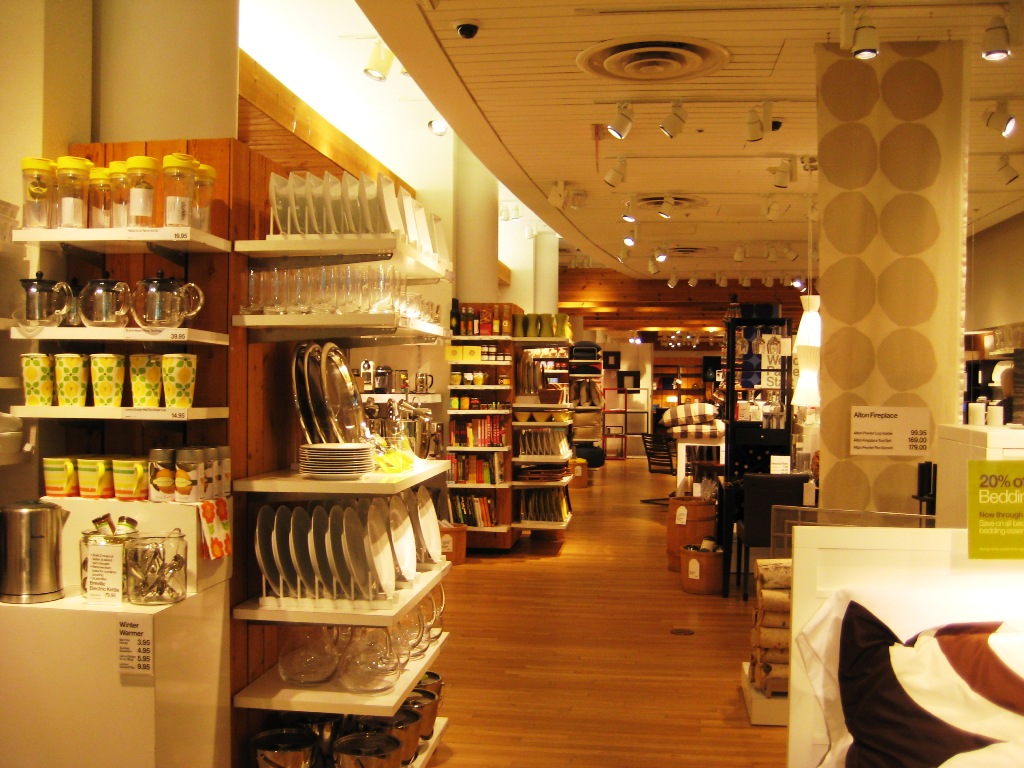
If you have ever shopped in Crate & Barrel, you will see that its store aesthetic harkens back to that of its original 1960s stores. Its European-inspired furniture, glassware, dishes, throw pillows and decor are all displayed on unassuming shelves in an airy, inspiring layout. Each product is carefully lined up in rows, stacks, bins and buckets to assemble a beauty-by-sheer-quantity look. Crate & Barrel stores include convenient wedding registries, friendly staff, and beautiful whites and wood tones that beckon you to buy.

Crate & Barrel Store
Though the stores are a sight to be seen, in my opinion, the real brilliance of Crate & Barrel’s merchandising lies in its online store, where Crate & Barrel has leveraged Web analytics, multivariate testing and A/B Testing to ensure that its Web Site converts the maximum amount of site visitors into sales. Here’s how they did it:
What Exactly is Multivariate Testing?
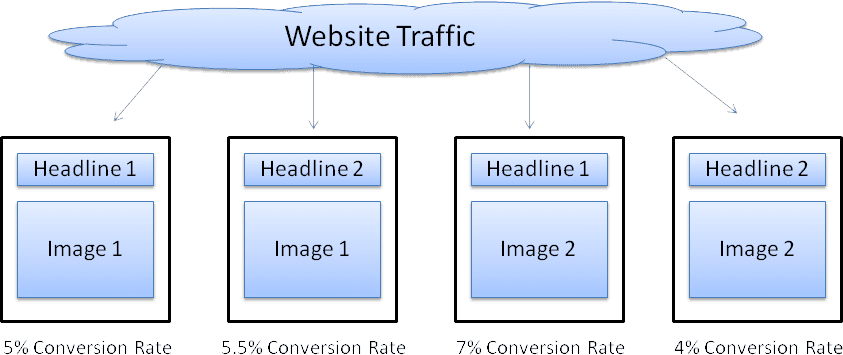
Let’s start with “multivariate testing.” According to VisualWebSiteOptimizer.com, multivariate testing requires directing different Web site visitors to different versions of the Web site in order to test which version of the Web site produces the desired outcome. Items such as headlines, tag lines, images, colors, buttons, text, logo placement, etc. are manipulated in the test groups to see which items generate sales, clicks-through, or donations, or whatever site’s key performance indicators (KPIs) are.
Here is a visual that may help you understand multivariate testing:
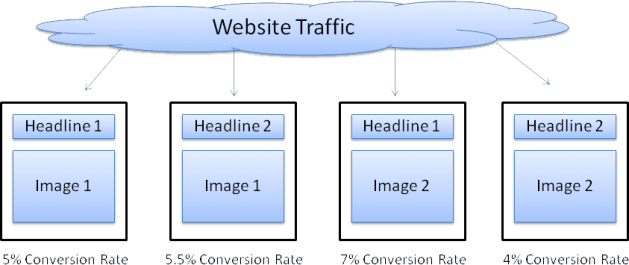
Image Credit: Visual Web Optimizer
What Exactly is A/B Testing?
Along with multivariate testing is “A/B Testing.” According to Optimizely, A/B Testing is the process of “pitt[ing] two variations against each other.” A good example of A/B testing is changing the text on a check out button to read “Buy Now” or “Checkout” and testing with two random groups to see which button generates more sales. Other items can be manipulated as well, including the check out button’s color, placement, size, etc. This may help you visualize A/B Testing:
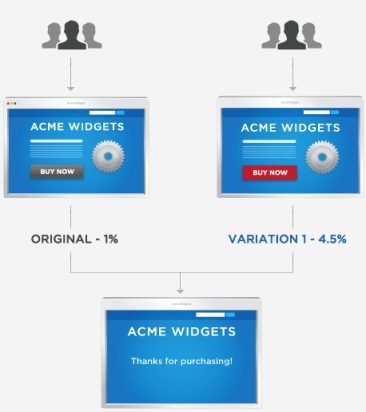
Image Credit: Optimizely
By testing literally every detail of a Web site, multivariate and a/b testing can help companies identify the most compelling layout to psychologically stimulate customers to perform the desired actions.
How Crate & Barrel Used Testing to Perfect its Site
Crate & Barrel uses multivariate and a/b testing to continue to improve its Web site, according to Examiner.com. Joan King, Crate & Barrel’s ECommerce Director and Site Optimizer and Analyst, explained that Crate & Barrel saw a 20% increase in conversion rate “due to simple changes in wording and color,” according to Examiner.com. Crate & Barrel is ALWAYS testing, and many of the tests run for two weeks at a time to allow Crate & Barrel to get an accurate read on how site visitors are responding to the small changes. Here is what the site looks like on my computer today. It may look just slightly different for you or just slightly different tomorrow because Crate & Barrel is constantly using Web analytics to improve its site.
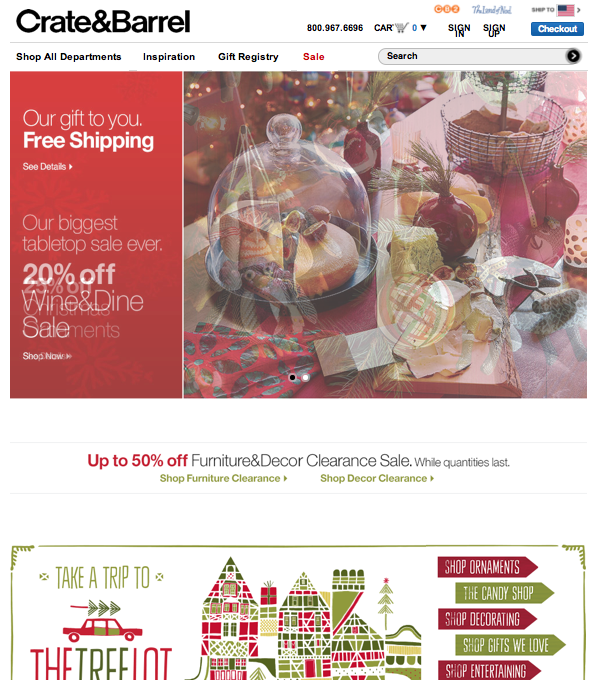
Crate & Barrel Homepage: December 9, 2013
Where Web Analytics Comes In to Perfecting Web Sites
Now that we’ve discussed how Crate & Barrel changes visual elements on its Web site to improve the aesthetics and conversion rate of its Web Site, let’s examine how exactly they know which visual variations are winning out. Crate & Barrel uses the Searchmetrics software for its SEO Analytics, and it uses Omniture SearchCenter for its Web Analytics. Omniture provides Crate & Barrel with a whole slew of Web analytics data, but a few funnels receive the majority of the attention when testing different visual elements. (Refresher from an earlier blog of mine: Funnels are “path[s] that you expect visitors to take on the way to a conversion goal,” according to Web Metrics & SEO Lesson 6.)
According to a Lecture given by Joan King, Crate & Barrel keeps a close eye on its “Confirm page” and on those who proceed to check out without ever completing the transaction at the “Confirm page.” This information helps determine if the visitors were converted into sales. With each visual element change, Joan King and her team are asking, “Did this element do better or worse at driving site visitors to the confirm page?” If the answer is yes, then the element is implemented (and possibly vetted against other options in the future). Monitoring this funnel and the actions visitors take to get to the goal page (Confirm) helps ensure that each tweak is helping Crate & Barrel get closer to a perfect Web site both aesthetically and logically.
How to Make this Work For You
If you want to perform multivariate and/or a/b testing on your Web site, there are services you can subscribe to that will help you pull off this testing. One of the companies I mentioned earlier, VisualWebSiteOptimizer.com, does just that. Or, you may be able to perform your own version of multivariate or a/b testing by modifying specific visual elements of your Web site and leaving them active for a couple weeks at a time. Though this will not get as accurate of a read (due to different time frames, instead of simultaneous testing), it can shed some light on which elements preform better. Then, as these elements are implemented, use your Google Analytics account to keep an eye on your Multi-Channel Funnels and on your goal pages (i.e. your “confirm” page, or your “Thank you” page). Also keep an eye on the traffic flow people follow in your site, and keep an eye on your E-Commerce reports (specifically your Sales Performance Report and your Time-To-Purchase Report) to see if the changes are resulting in the conversions you wish to earn.
Armed with tested and tried data, you’ll be well on your way to perfecting the details of your Web site and increasing your conversion rate.